Cookie preferences

HundrED uses cookies to enhance user experiences, to personalise content, and analyse our web traffic. By clicking "Accept all" you agree to the use of all cookies, including marketing cookies that may help us deliver personalised marketing content to users. By selecting "Accept necessary" only essential cookies, such as those needed for basic functionality and internal analytics, will be enabled.
For more details, please review our Cookie Policy.
Accept all
Accept necessary
search
clear

Agent Exoplanet

Study known exoplanets using images taken by Las Cumbres Observatory’s robotic telescopes

Astronomers at Las Cumbres Observatory are investigating exoplanets - planets which orbit stars other than our Sun - and you can too.Joining You'll measure the brightness of a star while a planet moves between it and our viewpoint. You can examine as many images, from as many exoplanet transit events, as you like and contribute to understanding the properties of each exoplanet.

Overview

Information on this page is provided by the innovator and has not been evaluated by HundrED.

2018

Established

-

Children

1

Countries
Updated
December 2018
Astronomers at Las Cumbres Observatory are investigating exoplanets - planets which orbit stars other than our Sun - and they’d like your help!

About the innovation

Mission Brief

Astronomers at Las Cumbres Observatory are investigating exoplanets - planets which orbit stars other than our Sun - and they’d like your help.

Discovering exoplanets is tricky since they are so faint compared to the stars they orbit. It requires detective work. Your mission, should you choose to accept it, is to look through a sequence of images recently taken by our telescopes in Hawaii, Australia and California and help us to spot these exoplanets and measure their size.
Implementation steps

Choose your planet

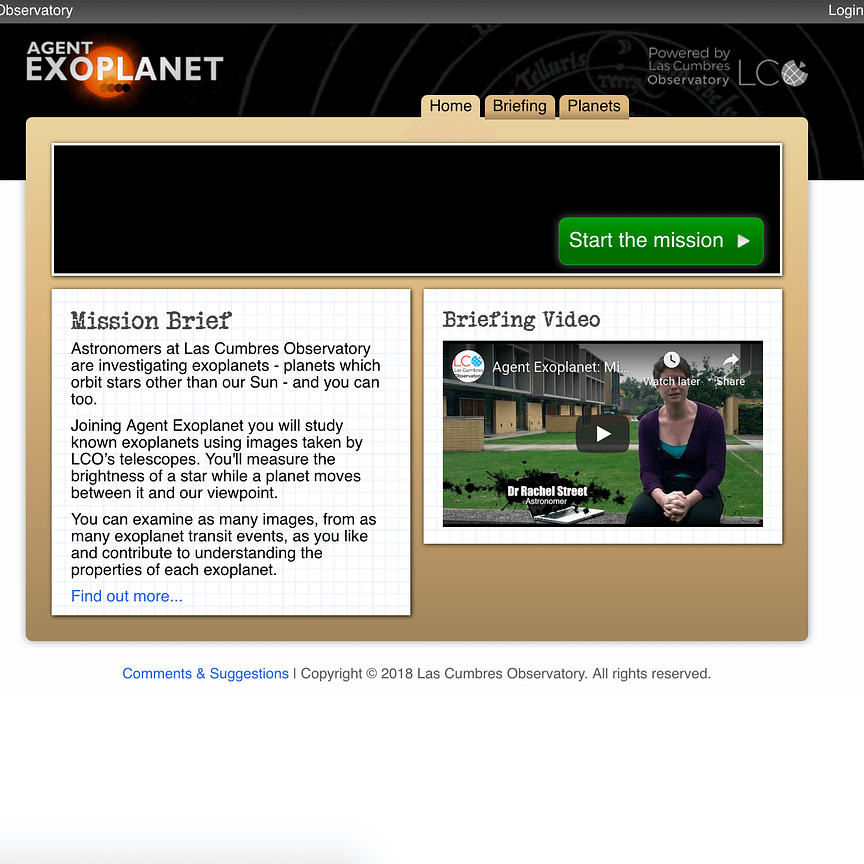
Go to https://lco.global/agentexoplanet/ and click "Start your mission"

Now you can choose one of the exoplanet polaroids to start your brightness measurements. Each polaroid shows you the planet's name and how many images are in the set.

You will then be taken one by one to images of a patch of sky containing the star and exoplanet (although only the star is visible because the exoplanet is very faint in comparison).

Each image will look very similar because they are of the same patch of sky but at different times. You will analyze each image to capture the dip in the brightness of the star as the exoplanet passes in front of it.

Analyze your images with the Light Monitor

The first thing you will see is an area of sky in the middle of the screen. On the left you will see a smaller image, called a finder chart, of this same patch of sky.

On the finder chart is a crosshairs that indicates the star in the image that has the known exoplanet - the target star. On your working image you will see a small circle with the word Target next to it. Click on the word and drag the circle over the target star.

Next you will see that a circle labeled blank sky has appeared. Drag this to a patch of sky near the target star, and place it on an area with no stars at all.

Next you will see that a new circle labeled Calibrator has appeared. Drag this to a star in the image that seems to be a similar size to the target star. Choose as many calibrator stars as possible, these shouldn't have any other bright stars overlapping it or very close by.Using more calibrators will help make your results more accurate, but only if they are placed on the stars you have used throughout your set!

Check your plots

Click the “Analyze Image” button to the left of the image to see small graphs pop up near each of your circles.

Each graph has a green and a blue curve. Just make sure there is only one bump of each color and you have a complete bump and the 2 bumps are close together and about the same size.

Classify your lightcurve

You will see a lightcurve made using each of your calibrators. One-by-one we would like you to classify your lightcurves using the buttons on the right.

Remember, we are looking for a big dip in the brightness.

If you have anything that is not a dip (e.g. a sharp spike, up and down) then use the buttons to mark it. You can change your mind at any time, just click the button you want.

You can also download the data values from there, if you would like to plot the lightcurves in a spreadsheet!

To see the combined results of everyone who is analyzing this exoplanet transit, click "Final Result". If more people analyze the images of this transit the better quality the final result will be. The final result will show you how big this exoplanet is.

Spread of the innovation

loading map...