The Henry Ford is committed to inspiring tomorrow’s innovators and helping learners from all backgrounds develop the skills they need to address global challenges. Innovation Atlas helps our innovation learning community identify areas with higher barriers to innovate and develop strategic priorities for funding, outreach, educational engagement and impact.
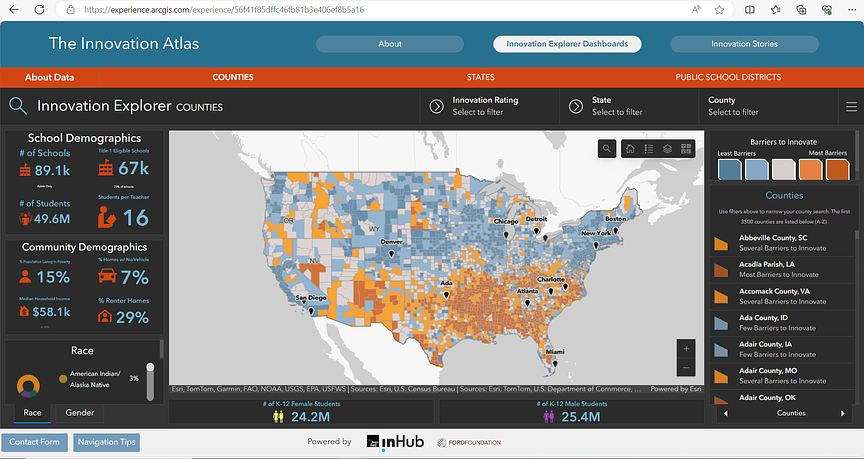
The Innovation Atlas is an interactive custom mapping tool, or geographic information system (GIS), of the United States. Leveraging the initial release of social mobility data from the Opportunity Atlas at Harvard University, The Henry Ford built a custom proprietary model that includes school attributes, socioeconomic attributes and validated research to produce the Innovation Atlas Score. The score is then applied to 85,000 public schools across America, providing transparency about the inequitable barriers and justifying the need for innovation education. We tested the platform with our Invention Convention Worldwide program affiliates, organizations that include university and non-profit K-12 STEM outreach teams. These affiliates use the data visualization in funding proposals to direct program outreach in areas with higher barriers to innovate. One university secured funding to support resources to bring their invention education program to rural counties.
In 2023, we introduced the Innovation Atlas (IA) to STEM education partners in government, non-profit and corporate sectors. One federal agency used it to identify educators in regions with higher barriers to innovate for inclusion in their programs. A global sponsor is mapping their CSR programs and an entrepreneur uses it to identify school districts to deliver Hispanic STEM programming. In 2024, IA has been showcased at national education forums including the InventEd Convening, U.S. Department of Education You Belong in STEM webinar, and STEM Learning Eco-Systems annual meeting. We will issue a white paper this spring with a goal to grow awareness and usage from more organizations leveraging the tool and data to advance innovation equity across the country.
To access the Innovation Atlas, sign up for The Henry Ford inHub (it’s free to join) https://inhub.thehenryford.org/signup with an email address. We’ve created a demo video https://www.youtube.com/watch?v=9bvtnfy0Ugw to help orient audiences. For additional data elements, functionality and customized support, contact us directly to learn more at innovationatlas@thehenryford.org.