We are using cookies to give a better service experience. By using our services you agree to use cookies. Read more

Accept
Reject
search
clear

Mend the Gap, Powered by Kimche

Working with schools to close achievement gaps in K-12 education.

Schools around the world have long struggled to provide every student (especially those most vulnerable) with a personalized educational experience. We automate data processing & create meaningful visualizations so that schools can reach every student and close gaps across race, gender, and economic status. We serve over 40,000 students, save schools lots of $$ and change student lives.

Overview

Information on this page is provided by the innovator and has not been evaluated by HundrED.

Web presence

2018

Established

-

Children

2

Countries
Updated
December 2018
Closing the achievement gap

About the innovation

What we do

The mission of Mend the Gap is to close the achievement gap. We do this through automated and customized data visualizations and reports. It's very exciting because we get to help schools do more of what they do well (working with students and families) by automating the difficult process of processing data.

Our platform is fully customized to meet the needs of your school/district. We focus on your specific needs and then build beautiful and meaningful visualizations that give you the information that you need to support all of your students. For example, one of our partner schools in Santiago, Chile wanted to improve their attendance rates because they noticed that too many students were chronically absent. We built a visualization like the one you see below to uncover the why behind student absences.


Getting to the why and beyond the what is a key part of what makes Kimche such an important tool. The reality for schools is that they are always working very hard with limited resources, so having the capacity to dig deep into data intersections is one that is often unobtainable. We remove that barrier and give you direct access to your visual data and update it on a weekly basis so that you are constantly gaining new insights into the needs of your students.

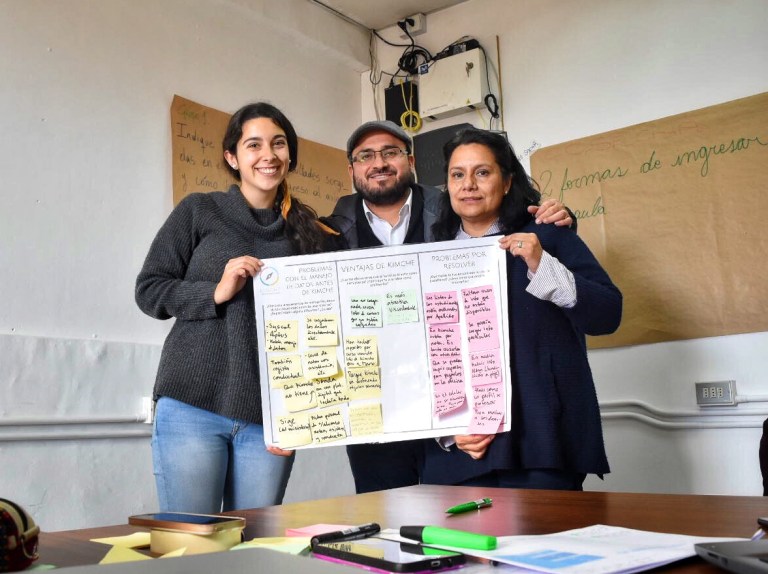
Our flagship product is called Kimche. In the indigenous Mapuche culture of South America, Kimche means "wisdom." We wish to provide all educational stakeholders the wisdom that comes from making sense of big data and individualizing student supports. We have made tremendous progress in Chilean schools in the specific areas of attendance and retention and are ready to scale our efforts.

We have a great track record of positive results with our partner schools. We work with schools to identify areas of need and support and then design our visualizations and reports on those needs. Schools all use multiple data points from semi-annual benchmark assessments, anecdotal evidence, as well as academic performance, attendance, behavior, and health data. Schools often meet in teams to help navigate their way through these disparate data sources to better support the needs of individual students. Kimche by Mend the Gap serves as the solution between data collection and intervention.


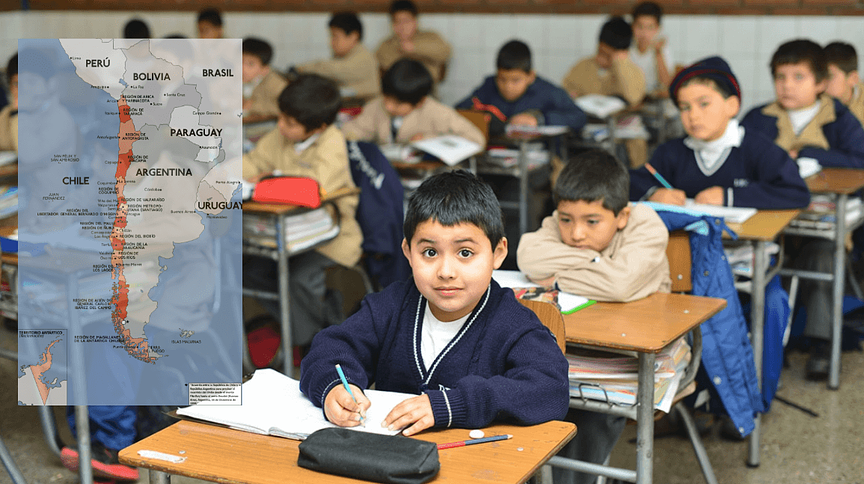
Kimche has increased attendance rates throughout Chile and increased state subsidies to schools by millions of dollars! The state subsidy in Chile is directly connected to attendance so when attendance goes down so does the amount of funding for a school. This specific issue allowed us to customize Kimche to address attendance in schools, resulting in a year over year increase of attendance of 2.8% and a national subsidy increase of over $20,000,000!

We are unique in our commitment to solving problems and customizing our solutions to the needs of individual customers and that approach has proven successful. Our approach is always to support each individual student and we do that by giving schools access to important student information in easy to understand and easy to use visualizations.

Our visualizations help schools look at historic data to optimize plans for the future. Seeing longitudinal data in practice is powerful and has the ability to transform how schools support each student and we are proud to help make this happen.

We are ready to scale globally after a number of documented successes in Chile. Mend the Gap is based in Pittsburgh and we are committed to making a difference here at home. With a product that's ready to use in schools across the world, we are eager to start getting feedback from our local community and start closing the achievement gap.

Implementation steps

Identify need
  • Start with a small group of internal stakeholders to think about how your school/district defines student success. Perhaps you want to specifically focus on literacy. Consider the factors that determine a student who is able to read and write on grade level. What are the indicators that show you a student is successful? Perhaps the student's reading level is the final indicator and because on-grade fluency by grade 3 is a major milestone you may decide to use that as a success measure.
  • Now that you've identified a possible success metric we recommend that you view success rates by demographic group (race, gender, SES status). What students at your school are most likely (historically) to achieve reading fluency by the end of third grade? Do success rates look different for different demographic groups? Is there a gap? For example, do female students out perform male students or white students out perform Hispanic students? What have you not been able to provide these students in the past? These are the gaps that we want to close to identifying them will get us started on the right path.

Stakeholder meeting

We like to start with a small group meeting to talk about your current situation and your school's/district's needs. Rather than starting with the technology, we start with a conversation about current initiatives and academic and social needs of your students. If you were able to complete step 1 by yourself that's great. If not, we can have that conversation together so that we best support your needs. We try to determine where to focus first, for example, we might determine that your goal is to have 100% of your students at or above reading level by third grade. This helps to narrow our implementation focus to k-3 students with an emphasis on literacy.

Your specific needs and focus will be unique and related to the needs of your students. This step provides you with the space and opportunity to consider options that weren't available to you previously due to budget or time constraints. We encourage you to think about what could be as opposed to what has been because we want to help you get there.

This step is perhaps the most important step in the entire process because we build your custom solution based on your specific needs. It's important to know that we will expand our efforts over time and can always begin with more than one initiative, but we try to begin with a very clear and specific goal in mind so that we can clearly track progress over time.

List all data sources

Schools use data from a number of different sources including grade books, learning management systems, student information systems, benchmark assessment tools, and more. The work required to analyze data from all of these sources is quite extensive and can be overwhelming for a school so we take that off your hands.

We talk about what data management platforms your school/district is currently using. We have a specific focus on the platforms that have relevant data for the area of focus that we identified in step 2 but also go beyond that because we often find intersections across data points that are otherwise ignored. For example, we have done a lot of work in improving attendance rates at schools because we uncover the underlying reasons of why students are missing school. Just knowing that a student is absent usually isn't enough to determine why a student is absent, especially once absences become chronic.

Once we know the data sources we work to retrieve historic data and begin to build your customized solution!

Set Goals

Getting to step 4 is a big moment and it's very exciting. We have identified your area of focus and the data sources that we will work with. Now we can set some goals and build a timeline for implementation. Let's say our focus is to get all students to reading fluency by the end of third grade. That's a great focus! So how do we get there? Since we've already identified your data sources we can get a sense of how far you are from getting students to full proficiency by third grade. As we look at your data, we identify possible trends that may exist across race, gender, or SES. This is very important because it allows us to focus attention on students that need the most support which can be helpful when creating a goal. For example, we may determine that, historically, your district does a stellar job at getting most of your students to reading proficiency by the end of third grade but students that come from low SES households are not achieving the same degree of success. This leads us to a goal of improving reading fluency of low SES students on an identified timeframe.

Our goals will change and get more complex as we begin to analyze more data over time. Because we are processing your data and providing you with visualizations and reports you are going to very quickly have a sense of how students are performing!

Custom Visualization & Reporting Time!

This is where things get really exciting! We've had a number of meetings up to this point and have been able to identify areas of focus and a specific goal. Now, Mend the Gap will start building your custom platform!

Our visualizations are designed specifically for you to achieve your identified goal, meaning there is never a one size fits all solution. We are here to build a unique model based on your unique needs. Just as no two people are exactly the same, no two schools are exactly the same.

We provide you with access to the platform and then talk about what reports you would like us to automate for you. Schools often choose to have us automate an email report to families and teachers with relevant data on a weekly basis. The great thing about this is that Mend the Gap takes care of the whole process and your key stakeholders are constantly in the loop.

Our visualizations are updated weekly so you get to track progress toward your goal(s) and adjust practices accordingly. Now you are ready to fully utilize Kimche for your day to day needs!

Spread of the innovation

loading map...